A Restaurant's Violation Count Is Mostly Bookkeeping
In short
- Boulder County and Tri-County, Colorado use the same 56-item inspection form, and their violation counts differ 2.65×. Boulder inspectors leave 58% of the form unmarked, and Tri-County’s format can’t record “not checked”.
- Marin County’s violations per inspection fell 74% in one year, with the same inspectors and the same restaurants, and no data migration explains it.
- After controlling for restaurant and year, which inspector visits moves the count by 172% of the mean.
- A violation count means something within one jurisdiction, one era, and one inspector. Comparisons across any of those break.
Every US health department publishes restaurant inspection results, and a long line of apps has tried to put them in front of you at the moment you pick a place to eat. The premise is that a violation count tells you something about the kitchen.
I wanted to compare a few jurisdictions and see how much the standards really vary county to county. What I found is that you can’t run that comparison at all, and the reason is more interesting than the comparison would have been.
Everything below comes from live public APIs. The code is here and regenerates every number with the standard library and no API key.
Two counties, one form, 2.65x apart
Boulder County and Tri-County (Adams, Arapahoe, Douglas) both publish to Colorado’s open data portal, and both run the same 56-item FDA Food Code checklist. Same instrument, same violation codes FC01 through FC56, same state.
Routine inspections, 2019 through October 2022, where their datasets overlap:
| violations per inspection | n | |
|---|---|---|
| Boulder County | 2.10 | 1,984 |
| Tri-County | 5.57 | 7,886 |
My first thought was that Tri-County is stricter. The data seemed to agree. Tri-County was a single agency covering three counties, which splits geography from regulator, and within it the three counties sit at 5.83, 5.36, and 5.54. Under one agency, across two county lines, the spread is about 9%. Between agencies it’s 165%.
Then I held the restaurant constant. A Subway is a Subway: same corporate procedures, same equipment, same audit regime.
| chain | Boulder | Tri-County |
|---|---|---|
| Subway | 2.42 | 4.41 |
| Starbucks | 0.65 | 2.18 |
| Chipotle | 0.69 | 1.94 |
| McDonald’s | 1.47 | 3.11 |
| Taco Bell | 1.00 | 3.36 |
| Wendy’s | 0.11 | 4.47 |
| pooled | 1.15 | 3.16 |
Nine chains, all nine pointing the same way, 2.76x pooled. At that point I was confident there was a real difference in enforcement between two neighboring Colorado health departments.
The number is a fraction and I only had the numerator
Boulder publishes one row per checklist item, with a status on each. Tri-County publishes one row per inspection with 56 binary flags.
The difference is in what each format can express.
| what the inspector recorded | Boulder | Tri-County |
|---|---|---|
| cited | Out, Out-High, Out-Medium, Out-Low |
flag = 1 |
| looked, found it fine | In |
indistinguishable |
| didn’t look | Not Observed |
indistinguishable |
| doesn’t apply here | Not Applicable |
indistinguishable |
Boulder can say “I checked this and it was fine” and “I never checked this.” Tri-County’s format collapses both into a zero.
So I counted how much of the form Boulder inspectors actually evaluate:
| items on form | items evaluated | violations | rate per evaluated item | |
|---|---|---|---|---|
| Boulder | 56.8 | 24.1 | 2.10 | 8.7% |
| Tri-County | 56 | unknowable | 5.57 | 9.9% if all 56 |
Boulder inspectors leave 58% of the form untouched. Divide by what was actually looked at and 2.65x becomes about 1.14x.
Even that overstates the residual, because Tri-County’s denominator can’t be recovered. If their inspectors also evaluate around 24 items, their true rate is roughly 23%, which is more than double Boulder’s, and the sign of the effect flips. Boulder’s rate is bounded. Tri-County’s is not.
Montgomery County, Maryland runs a 15-item form with the same three-way vocabulary and marks 2% to 6% of items “Not Observed” where Boulder marks 58%. There’s no national convention to normalize against, which is exactly why this is invisible to anyone comparing published counts.
The same problem shows up across time
If the number moves when the recording convention moves, it should also move inside a single jurisdiction whenever that jurisdiction changes how it writes things down.
Marin County, California publishes 12 years of inspections. Violations per routine inspection, by year:
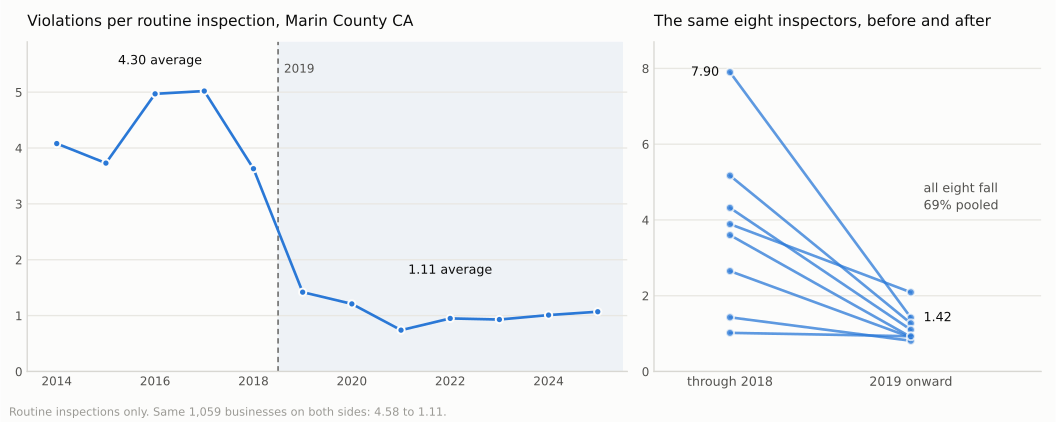 Left: the series breaks at 2019 and never recovers. Right: every inspector working on both sides of the break drops.
| 2014 | 2015 | 2016 | 2017 | 2018 | 2019 | 2020 | 2021 | 2022 | 2023 | 2024 | 2025 |
|---|---|---|---|---|---|---|---|---|---|---|---|
| 4.08 | 3.73 | 4.97 | 5.02 | 3.63 | 1.42 | 1.21 | 0.74 | 0.95 | 0.93 | 1.01 | 1.07 |
4.30 down to 1.11 across a single year boundary. Inspection volume went up over the same period, from 1,351 routine inspections in 2018 to 1,514 in 2019. The violation code vocabulary didn’t change. The placard program had already been running since 2015.
Marin names the inspector on every row, which almost no jurisdiction does. So I could check whether the staff turned over. Inspectors with at least 40 routine inspections on both sides:
| inspector | pre-2019 | 2019+ | change |
|---|---|---|---|
| A | 7.90 | 1.42 | −6.48 |
| B | 5.17 | 1.27 | −3.90 |
| C | 4.32 | 1.10 | −3.22 |
| D | 3.89 | 2.09 | −1.79 |
| E | 3.60 | 0.91 | −2.68 |
| F | 2.65 | 0.90 | −1.75 |
| G | 1.43 | 0.81 | −0.62 |
| H | 1.02 | 0.93 | −0.09 |
Eight out of eight drop. Pooled, −69%. Inspector A is one person doing one job, going from 7.90 violations per inspection to 1.42.
And holding the restaurants constant: the 1,059 businesses inspected on both sides of the break went from 4.58 to 1.11.
Same people. Same restaurants. Same codes. A quarter of the violations.
What actually changed is visible in how inspections got classified. The share finding nothing barely moved, from 11-16% to 13-26%. The share classified as major fell from 23-39% to 8-15%, with minor absorbing the difference, and violations itemized per violating inspection fell from about 4.1-5.8 to 1.1-2.1. The odds an inspection finds a problem held roughly steady. The number of problems written down per inspection collapsed.
Checking whether I was looking at a migration
The explanation that would kill this is provenance. If the pre-2019 rows came out of a different system and were migrated in, the break is an artifact of the dataset rather than of practice.
Three tests, all negative:
Record IDs are continuous. One monotonically advancing sequence across all 13 years, with the ranges overlapping at the boundary: 2018 spans 25,039 to 37,081, and 2019 spans 24,518 to 42,338. No restart, no gap.
The schema doesn’t move. inspector, placard, correct_by_date, corrected_on_site, inspector_comments, inspection_frequency, and license_number all sit at 100% fill in every year from 2014 to 2026. The only field that changes is the violation code, from 96-97% to 67-90%, which is the finding rather than a schema change.
The extract fingerprint changes somewhere else. Some string values in this dataset are wrapped in literal quote characters. That artifact appears in 0% of rows through 2024, 83% in 2025, and 100% in 2026.
That last one is the strongest evidence here. The pipeline demonstrably changed, in 2025, not 2019. Had the 74% drop been a migration, the formatting signature would have moved with it.
It also caused the first bug I hit. Grouping by inspector without stripping those quotes gives you 46 inspectors. There are 40. Six of them are the same people showing up twice, once quoted and once not.
How common is a break like Marin’s
A reasonable objection at this point is that I went looking for a discontinuity and found one, and that health departments revise their paperwork constantly. So I checked three other long series the same way.
| jurisdiction | measure | span | largest one-year move |
|---|---|---|---|
| Boulder County CO | violations per routine inspection | 2013-2025 | 1.60 to 2.35 across 13 years, no break |
| Chicago | share of inspections failing | 2010-2026 | 16.0% to 24.9%, gradual drift, no break |
| New York City | share of violations flagged critical | 2022-2026 | 52.4% to 56.7%, no break |
Marin is the outlier. Boulder is the clean comparison, since it’s the same measure over a longer span, and it never moves more than about 20% year over year.
Two caveats on that table. Chicago’s pass/fail and NYC’s critical share are coarser instruments than a violation count, and a department could change how much it itemizes without either one moving. And NYC’s published series only reaches back to 2022, which is barely a test.
Taken together: a break like Marin’s is not the normal state of this data, and it’s not rare enough to assume away either. One of the four jurisdictions I have a long series for contains one, and nothing in the published data announces it.
That also strengthens the Colorado comparison. Boulder holding flat for 13 years means its side of the 2.65x gap isn’t an artifact of which years I happened to pick.
Who shows up is nearly as predictive as which restaurant
Chicago open-sourced its inspection-prioritization model, and an independent review found the largest single source of influence was which sanitarian performed the inspection. That was internal data. Marin’s inspector column makes it testable in public.
Across 15,888 routine inspections, 1,645 businesses, and 40 inspectors, raw inspector means run from 0.74 to 5.99. Most of that is the era, since inspectors work in different windows and the 2019 break sits in the middle.
So I subtracted the business mean, using the 1,453 businesses inspected by two or more different inspectors, and then subtracted the year mean:
| control | spread across inspectors | sd |
|---|---|---|
| raw | 8.1x | 1.41 |
| minus business mean | 5.18 violations | 1.27 |
| minus business and year | 3.81 violations, 172% of the 2.22 mean | 0.86 |
The ordering scrambles under the year control, which is what rules out a pure era story. The strictest inspector after controls started in 2025, on the lenient side of the break. The most lenient worked 2018-2019, on the strict side.
Crude variance shares on the raw series: business identity accounts for about 24%, inspector identity about 21%.
This is arithmetic demeaning rather than a fitted model, so treat it as direction and magnitude, not standard errors. Inspector and year are partly collinear, and the eight inspectors who span the break are carrying the identification. The other two findings don’t have that problem, since they’re raw means under exact controls.
Where that leaves it
Three axes, and the count fails on all of them. Across jurisdictions it moves 2.65x on a recording convention. Across time it moves 74% while the same people inspect the same restaurants. Across inspectors it moves 172% of the mean after controls.
None of this measures whether inspection works. Inspectors find real problems and close real kitchens, and nothing here speaks to that either way. What I measured is the number, and the number breaks specifically when you compare one to another, which is the only thing anyone downstream does with it.
The real exposure sits downstream of the lookup apps: city prediction models trained on violation outcomes, and studies comparing grading regimes across places or across a policy date. Chicago’s model was trained on outcomes like these, and its own audit found the inspector was the top predictor, which is what you’d expect when part of the target is clerical. A study spanning a jurisdiction’s own recording change runs into the Marin problem directly, since the series moves while the world holds still.
The practical version: a violation count is interpretable inside one jurisdiction, in one era, adjusted for who did the visit. Nowhere else. If you’re building on this data, the first thing to check isn’t the number, it’s whether your source can express “not observed,” and whether that convention held still over your window.
None of this is special to restaurants. A published count records what an institution wrote down, and one of the four departments I looked at changed how it wrote things down without saying so.
If you know what changed in Marin County in 2019, I’d like to hear it and I’ll update this. Every number here regenerates from the code against the live APIs, so check my work.