Most Top YouTube Comments Are Posted in the First Day, but the Ranking Keeps Moving for Weeks
In short
- Of the comments in a video’s top 20 a week after upload, 84% were posted in its first 24 hours. At day 20 it is still 82%.
- The page never settles. Two looks 12 hours apart share about 9 of their top 10 from day 4 to day 21, mostly by swapping comments at the edge, and a page fetched again 15 minutes later comes back identical, so the motion is the ranking, not the API.
- I wrote down eight predictions before any video was looked at twice. Three held, three failed, and two held in some languages only.
- On 7.15 million comments in English, Japanese and Chinese, timing and video size still explain 86–95% of what orders a comment’s likes.
In August I measured why some YouTube comments get more likes than others, and the answer was mostly timing: when a comment was posted, and on how big a video, explained 83.5% of the ordering. That study took one snapshot of each video after the fact, so it could say which comments ended up on top and nothing about how they got there.
In September I watched the ranking form.
How the panel worked
I enrolled 500 new videos and read the top of each one’s comment page twice a day for three weeks.
| the panel | |
|---|---|
| videos | 500, enrolled within 30 h of upload |
| languages | 167 English, 167 Japanese, 166 Chinese |
| channels | 205, at most five videos each |
| schedule | twice a day for 21 days |
| fetches | 20,454 pages of “Top comments”, up to 100 each |
| counted | videos with ≥100 comments (239 at day 7, 250 at day 20) |
Chinese here means channels from Taiwan, Hong Kong and overseas. Each fetch recorded every comment’s rank, likes and post time. The creator’s own comments are left out, since they are usually pinned. Every run also re-fetched 20 pages it had just fetched, to measure how much a page changes when nothing has happened.
I wrote down eight predictions on September 19, before any video had been looked at twice, each with the number that would count as a miss. That afternoon I moved the primary endpoint from day 14 to day 7, with days 14 and 20 kept as secondary ones. The plan is public, and so are its amendments, each with its date. A second study re-ran the August model on 7.15 million comments in all three languages.
Here is how the eight came out at day 7.
| prediction | the bar | day 7 | verdict |
|---|---|---|---|
| Top comments are posted early | ≥70% in 24 h, ≥30% in 1 h | 84%, 34% | held |
| The top 10 locks in fast | median ≤72 h | 76 h | failed |
| Rank feeds likes | ≥3× faster in the top 10 | 1.85× | failed |
| Languages lock in alike | within 24 h of pooled | yes | held |
| Shorts lock in faster | ≥24 h sooner | 16 h | failed |
| Exposure explains the likes | ≥70% share | 86–91% | held |
| Most comments get no likes | 75–90% at zero | 44–79% | English only |
| Text alone is weak | AUC under 0.60 | 0.582–0.602 | not Chinese |
Most of the top 20 was posted in the first day
Take the top 20 at the endpoint and look up when each comment was posted:
| top 20 at | posted within 1 h | within 6 h | within 24 h |
|---|---|---|---|
| day 7 (239 videos) | 34% | 65% | 84% |
| day 14 (243) | 35% | 65% | 83% |
| day 20 (250) | 33% | 63% | 82% |
The prediction was at least 70% within 24 hours and at least 30% within the first hour, and it held at every endpoint. The median comment in the day-7 top 20 was posted 2.4 hours after the video went up. Chinese comments start slower and catch up within the day.
| day-7 top 20, posted within | 1 h | 24 h |
|---|---|---|
| English | 36% | 84% |
| Japanese | 38% | 85% |
| Chinese | 24% | 83% |
The top 10 is still changing at day 21
The prediction I cared most about failed. I defined lock-in as the first look at which a video’s top 10 has a Jaccard similarity of at least 0.8 with its endpoint top 10 (about 9 of 10 comments in common), and predicted a median of 72 hours or less.
| measured against | median lock-in | 95% CI | locked within 72 h |
|---|---|---|---|
| the day-7 page | 76 h | 67 to 93 | 48% |
| the day-14 page | 146 h | 117 to 176 | 31% |
| the day-20 page | 138 h | 112 to 176 | 34% |
Day 7 was a narrow miss. Against later pages the median moves out to about six days, and it stops climbing between day 14 and day 20. Most videos that cross the line drift back out: measured against day 20, the median video stays within it for good only from day 19.
Two more predictions were about which videos lock in sooner.
| median lock-in | day 7 | day 14 | day 20 |
|---|---|---|---|
| all videos | 76 h | 146 h | 138 h |
| English | 82 h | 146 h | 116 h |
| Japanese | 69 h | 165 h | 189 h |
| Chinese | 80 h | 129 h | 151 h |
| Shorts | 64 h | 123 h | 97 h |
| long videos | 80 h | 148 h | 140 h |
The languages were supposed to stay within a day of the pooled median, and they did until Japanese at day 20. Shorts were supposed to lock in at least a day faster. At day 7, the endpoint the plan scores, the gap was 16 hours (CI 25 hours slower to 39 faster), so that prediction failed. At days 14 and 20 the gap clears a day, but both intervals span zero.
The page around it keeps moving anyway.
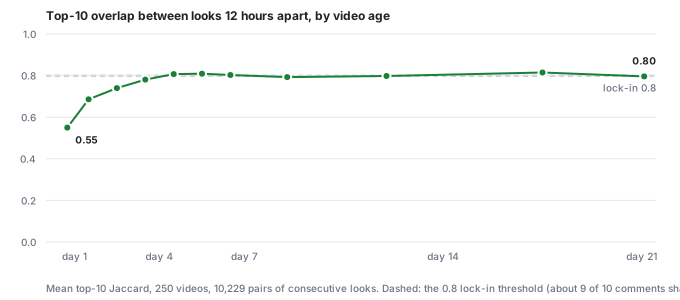 250 videos. Each point averages pairs of consecutive looks, grouped by the video’s age; the 18 pairs from videos under 12 hours old are left out.
About a third of those 12-hour steps change more than the lock-in threshold allows, and that share doesn’t fall in the third week. Against the day-20 page, the day-7 top 20 has a Jaccard of 0.65, roughly 16 of its 20 comments.
Little of that motion adds up.
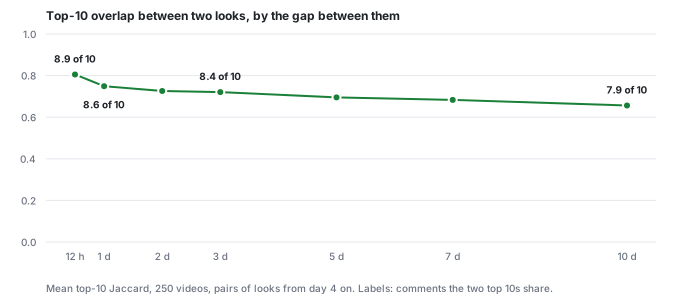 250 videos, pairs of looks taken from day 4 on.
A comment that falls out of the top 10 in a 12-hour step lands at a median rank of 13, and 46% are back within the next two looks. The page swaps comments at its edge every 12 hours and drifts away from itself much more slowly.
Most of the movement is old comments trading places. At day 7 the median video had six comments enter its top 20 after 72 hours, and 73% of those had been posted earlier and climbed. By day 20 that’s 13 per video, and every video in the analysis has at least one.
Late posts can win too, just rarely.
| final top-3 spots (1,338 on 482 videos) | share | videos |
|---|---|---|
| posted more than a day after upload | 15% | 150 |
| more than two days after | 9% | 104 |
| more than a week after | 3% | 34 |
One comment on an AsmonTV upload was posted 84 hours in, first seen at rank 72 with 2 likes, reached #1 on day 12, and finished with 467.
Being on top helps less than I assumed
The August post leaned on a feedback loop: a high rank gets seen, so it gets liked, so it stays high. I predicted that the same comment gains likes at least 3× faster while in the top 10 than while below rank 50.
It doesn’t. Here are the 2,484 comments seen in both places.
| where the comment sat | likes per hour |
|---|---|
| in the top 10 | 0.54 |
| below rank 50 | 0.29 |
| ratio (95% CI 0.96 to 3.22) | 1.85× |
The prediction was 3×. So it doesn’t clear the bar, and it doesn’t rule out no effect either. The median comment’s own ratio is 0.90, and half the movers gained nothing or lost likes below rank 50. A minority of comments carry the average.
The August result holds in three languages
The bulk study re-ran the August model on 7.15 million comments from 311 channels. Each comment’s likes are ranked within its own video and predicted from exposure (post time, video size), then length, then text. The model is tested on channels it never saw, over five different channel splits. Exposure share is how much of the model’s above-chance skill the exposure features alone reach.
| language | comments | median per video | exposure share | text AUC | zero likes |
|---|---|---|---|---|---|
| English | 5,421,217 | 798 | 86% (82–91) | 0.588 | 78.5% |
| Japanese | 1,125,472 | 348 | 91% (87–94) | 0.582 | 44.1% |
| Chinese | 606,043 | 299 | 90% (85–96) | 0.602 | 67.1% |
Exposure share, with its range over five channel splits, cleared the 70% bar in every language, with the MiniLM sentence encoder the August study used; with word TF-IDF instead it runs 86–95%. These run each text model separately, so they aren’t quite the August 83.5%, which stacked both.
Text alone was supposed to stay under an AUC of 0.60, where 0.5 is chance, and Chinese missed by a hair. MiniLM is an English model, and a character-level model in an exploratory run scored higher on both Chinese and Japanese, so an English encoder understates how much the text carries in those two languages.
The zero-likes share was supposed to be 75–90% in every language, near August’s 82%. Only English landed there. The Japanese and Chinese videos are also much smaller, and the study has no control for size, so that column mixes a language difference with a size difference.
Re-fetching a page returns the same page
Every drift number above assumes the API returns the same page when nothing has changed. On October 22 I tested that on 250 closed panel videos, fetching each top page normally and with the request altered so no cached copy could match it, and again later.
| two fetches of the same page | videos | top 20 identical |
|---|---|---|
| back to back, normal and cache-busted | 250 | 250 |
| 15 minutes apart | 84 | 84 |
| 1 hour apart | 83 | 81 |
| 2 hours apart | 83 | 79 |
The 15-minute replies almost always carried a different etag, so YouTube built each one fresh rather than replaying a stored copy. Where pages changed at one and two hours, the normal and cache-busted copies taken at the same moment still matched each other, so that is the ranking moving, not the API. The panel’s own repeats, a median 46 seconds apart, agreed too (1,130 pairs, a median top-10 Jaccard of 1.00). And the videos were still moving on a longer clock: against their last panel page ten days earlier, their top 10 had a Jaccard of 0.75.
The test has two gaps. It ran on videos a month old, quieter than they were during the panel, so it can’t rule out wobble that only shows up while a video is busy. And it measures the API, not the page a person sees. On day 3 I opened five panel videos logged out in a clean browser and compared them with the API page from six hours before. The top 10 matched 10, 5, 7, 8 and 8 of 10, about the same as the API’s own 12-hour drift on those videos (7 to 10). That’s five videos, once, and logged-in pages, which YouTube may personalise, weren’t measured.
The channels are a convenience sample of established creators, 300K to 15M subscribers, with comments open. None of this says anything about small channels.
Takeaways
- One snapshot shows who won, and nothing about whether the race is over. The August study saw a settled top 20. Watching it form showed a set mostly chosen on day one and an order that kept moving for three weeks.
- A stability number depends on what it is measured against. Lock-in looked like three days against the day-7 page and six against later ones. Any claim that something “settles by” a date needs its endpoint named.
- The mechanism everyone assumes can turn out small. Rank feeding likes is the obvious story for why top comments stay on top. Measured directly, it was under 2× and could be zero. The outcome replicated, and the explanation I gave in August got weaker.
- Write the predictions down before the data comes in. Three of eight failed, and those failures are most of what this post knows that the August one didn’t. Without a dated plan each would have been easy to explain away.
- Test the instrument before reading the drift. Every movement number here assumes the API returns the same page twice. A two-hour test settled that, and without it the main result would stay open to “maybe it’s caching”.
If you want a comment seen, post it on day one, and in the first hour if you can. A comment posted two or more days in still reached the top 3 on about one video in five.
Both corpora are in August’s Hugging Face dataset, the panel’s 1.46 million page rows and the 7.15 million bulk comments, with author IDs replaced by salted hashes.