aide: Measuring AI Coding Sessions
In short
- aide reads Claude Code and Codex session logs into SQLite and reports cost, tokens, and where sessions go wrong, across every project.
- It splits sessions into work blocks at 30-minute idle gaps, because a terminal left open for two days is not a 48-hour session.
- Repeated findings become proposed runbooks and session briefs, which you accept before they reach future sessions.
- It makes no LLM calls, costs nothing to run, and keeps everything local.
The METR study found developers believe AI makes them 20% faster. Measured: 19% slower. I wanted data on my own usage, so I built a local effectiveness tool.
What Is This
aide ingests Claude Code and Codex session logs (JSONL) into SQLite and shows what is happening across projects: cost, token usage, session patterns, effectiveness trends, review queues, and repeat workflow friction.
It also turns repeated findings into proposed project knowledge. You review and accept those artifacts before they become runbooks or start-session briefs for future human or agent work.
Zero LLM calls. Zero cost to run. All data stays local.
~/.claude/projects/**/*.jsonl → Claude parser → SQLite → aide
~/.codex/sessions/**/*.jsonl  → Codex parser  → SQLite → aide
The Problem
Claude Code and Codex generate detailed local logs: messages, tool calls, token counts, timestamps, commands, and metadata. The files sit under ~/.claude/projects/ and ~/.codex/sessions/. Nobody looks at them.
Everyone has opinions about whether AI coding tools are worth it. Nobody has data. Am I getting more efficient over time? Which projects eat the most tokens? Where do sessions repeatedly go wrong? Did a better instruction or runbook actually reduce friction?
The useful view is personal trends across all your sessions, plus a feedback loop that converts repeat mistakes into better future context. A single session transcript doesn’t show either.
How It Works
Data Pipeline
- Discovery - finds configured Claude and Codex JSONL sources
- Parsing - normalizes provider-specific events into one session model
- Work Blocks - splits each session into continuous coding periods at 30-minute idle gaps
- Ingestion - upserts into SQLite with incremental ingest, tracking file mtime
- Review Loop - ranks suspicious sessions, groups repeat causes, and proposes reviewable artifacts
Cost Estimation
All costs estimated at current API rates. For subscription users (Pro/Max), a toggle shows token-based metrics instead of dollar amounts.
Key Features
Overview Dashboard
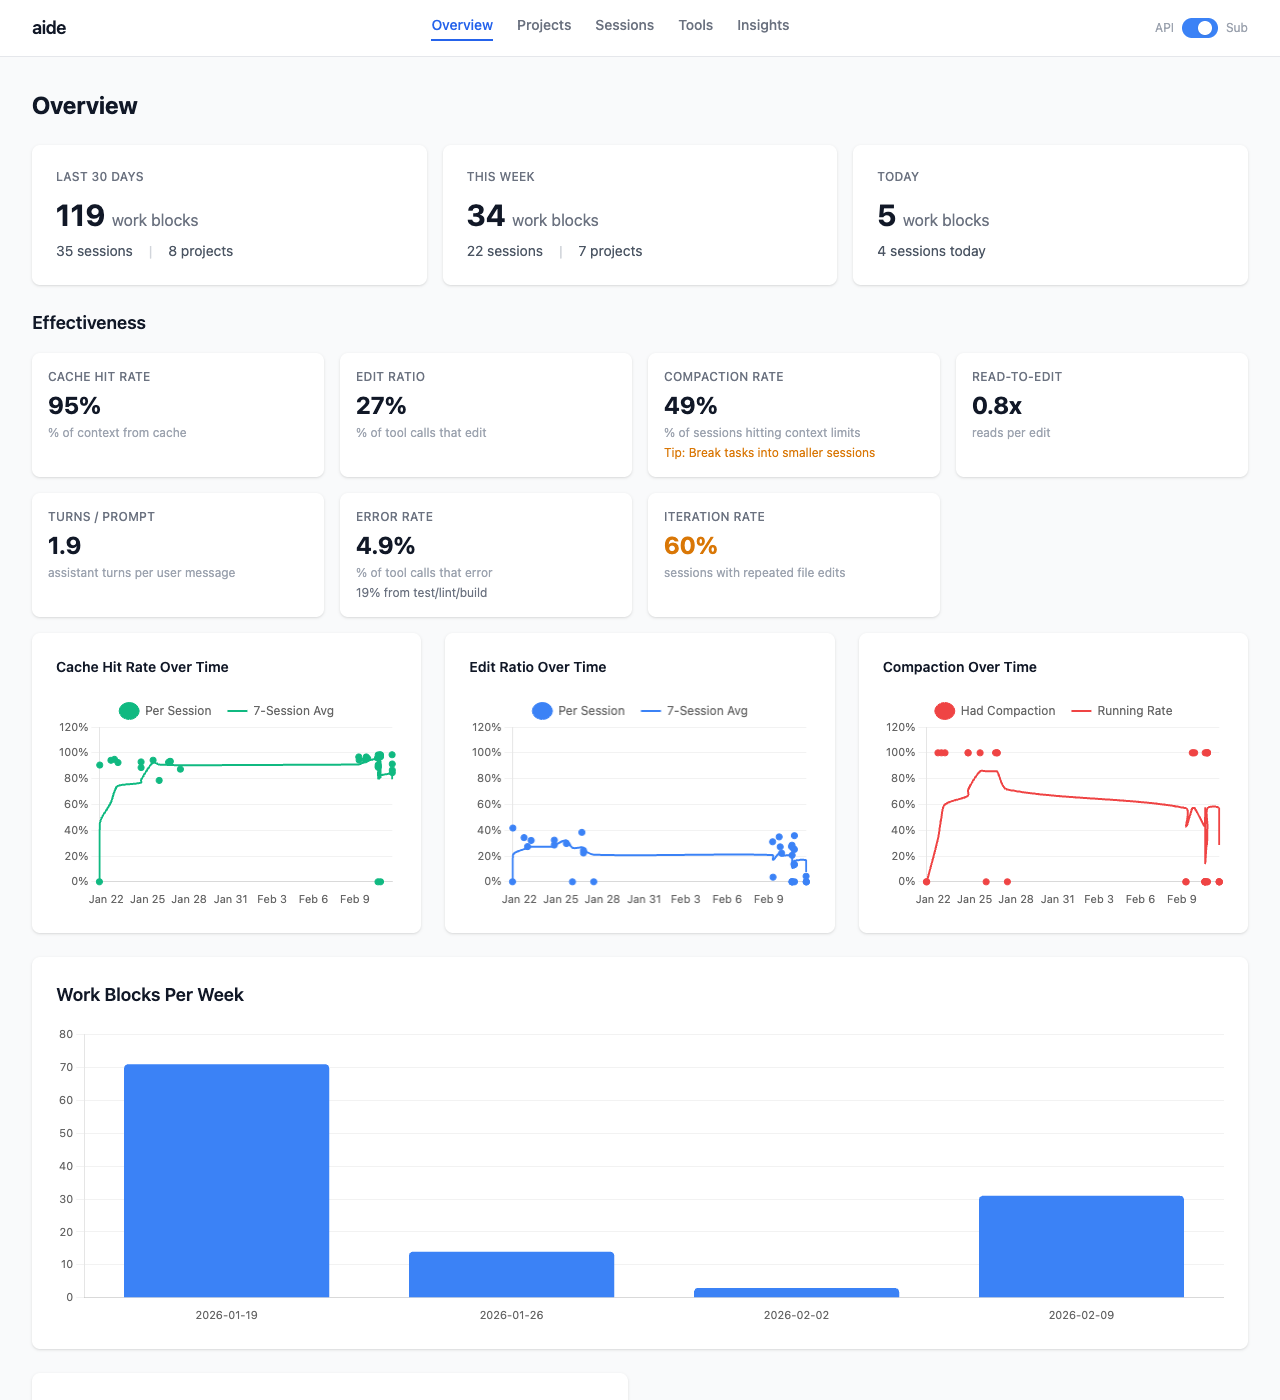
Summary cards, effectiveness metrics (cache hit rate, edit ratio, compaction rate, error rate), trend charts, work blocks per week.
Effectiveness
Project and provider rollups compare the last 30 days with the previous 30 days: average cost per session, active time, review queue rate, edit attribution, and tool error rate.
Action summaries group repeated investigation signals like no-edit work, weak project attribution, missing prefix rules, and edit attribution gaps. Each action links back to the sessions that caused it.
Session Detail
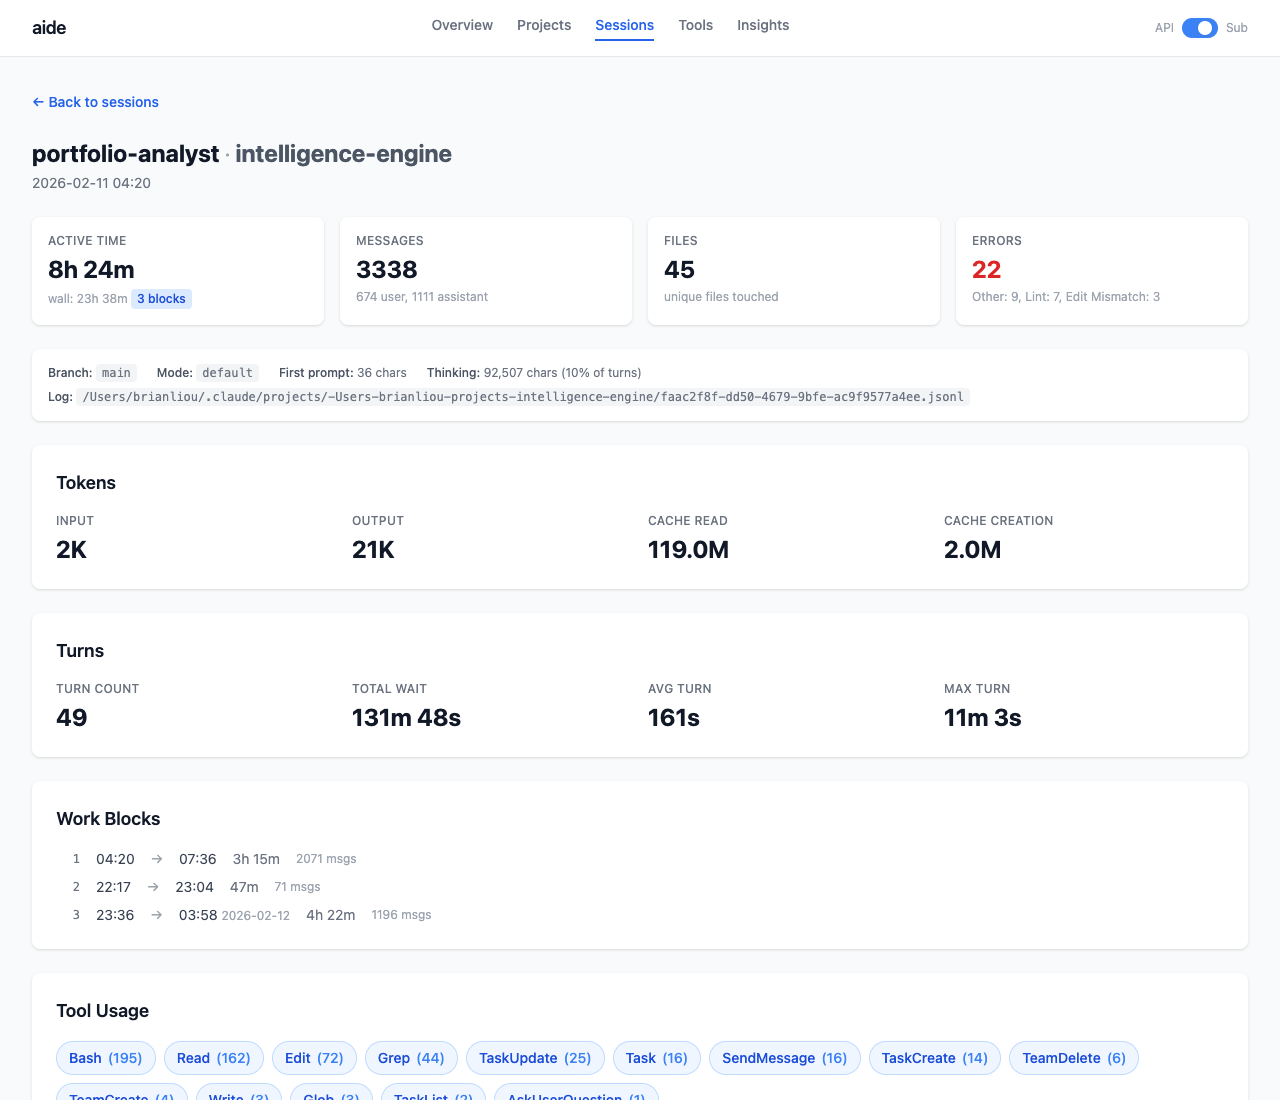
Drill into any session: token breakdown, tool usage, files touched with read/edit/write counts, work block timeline, error categorization.
Insights
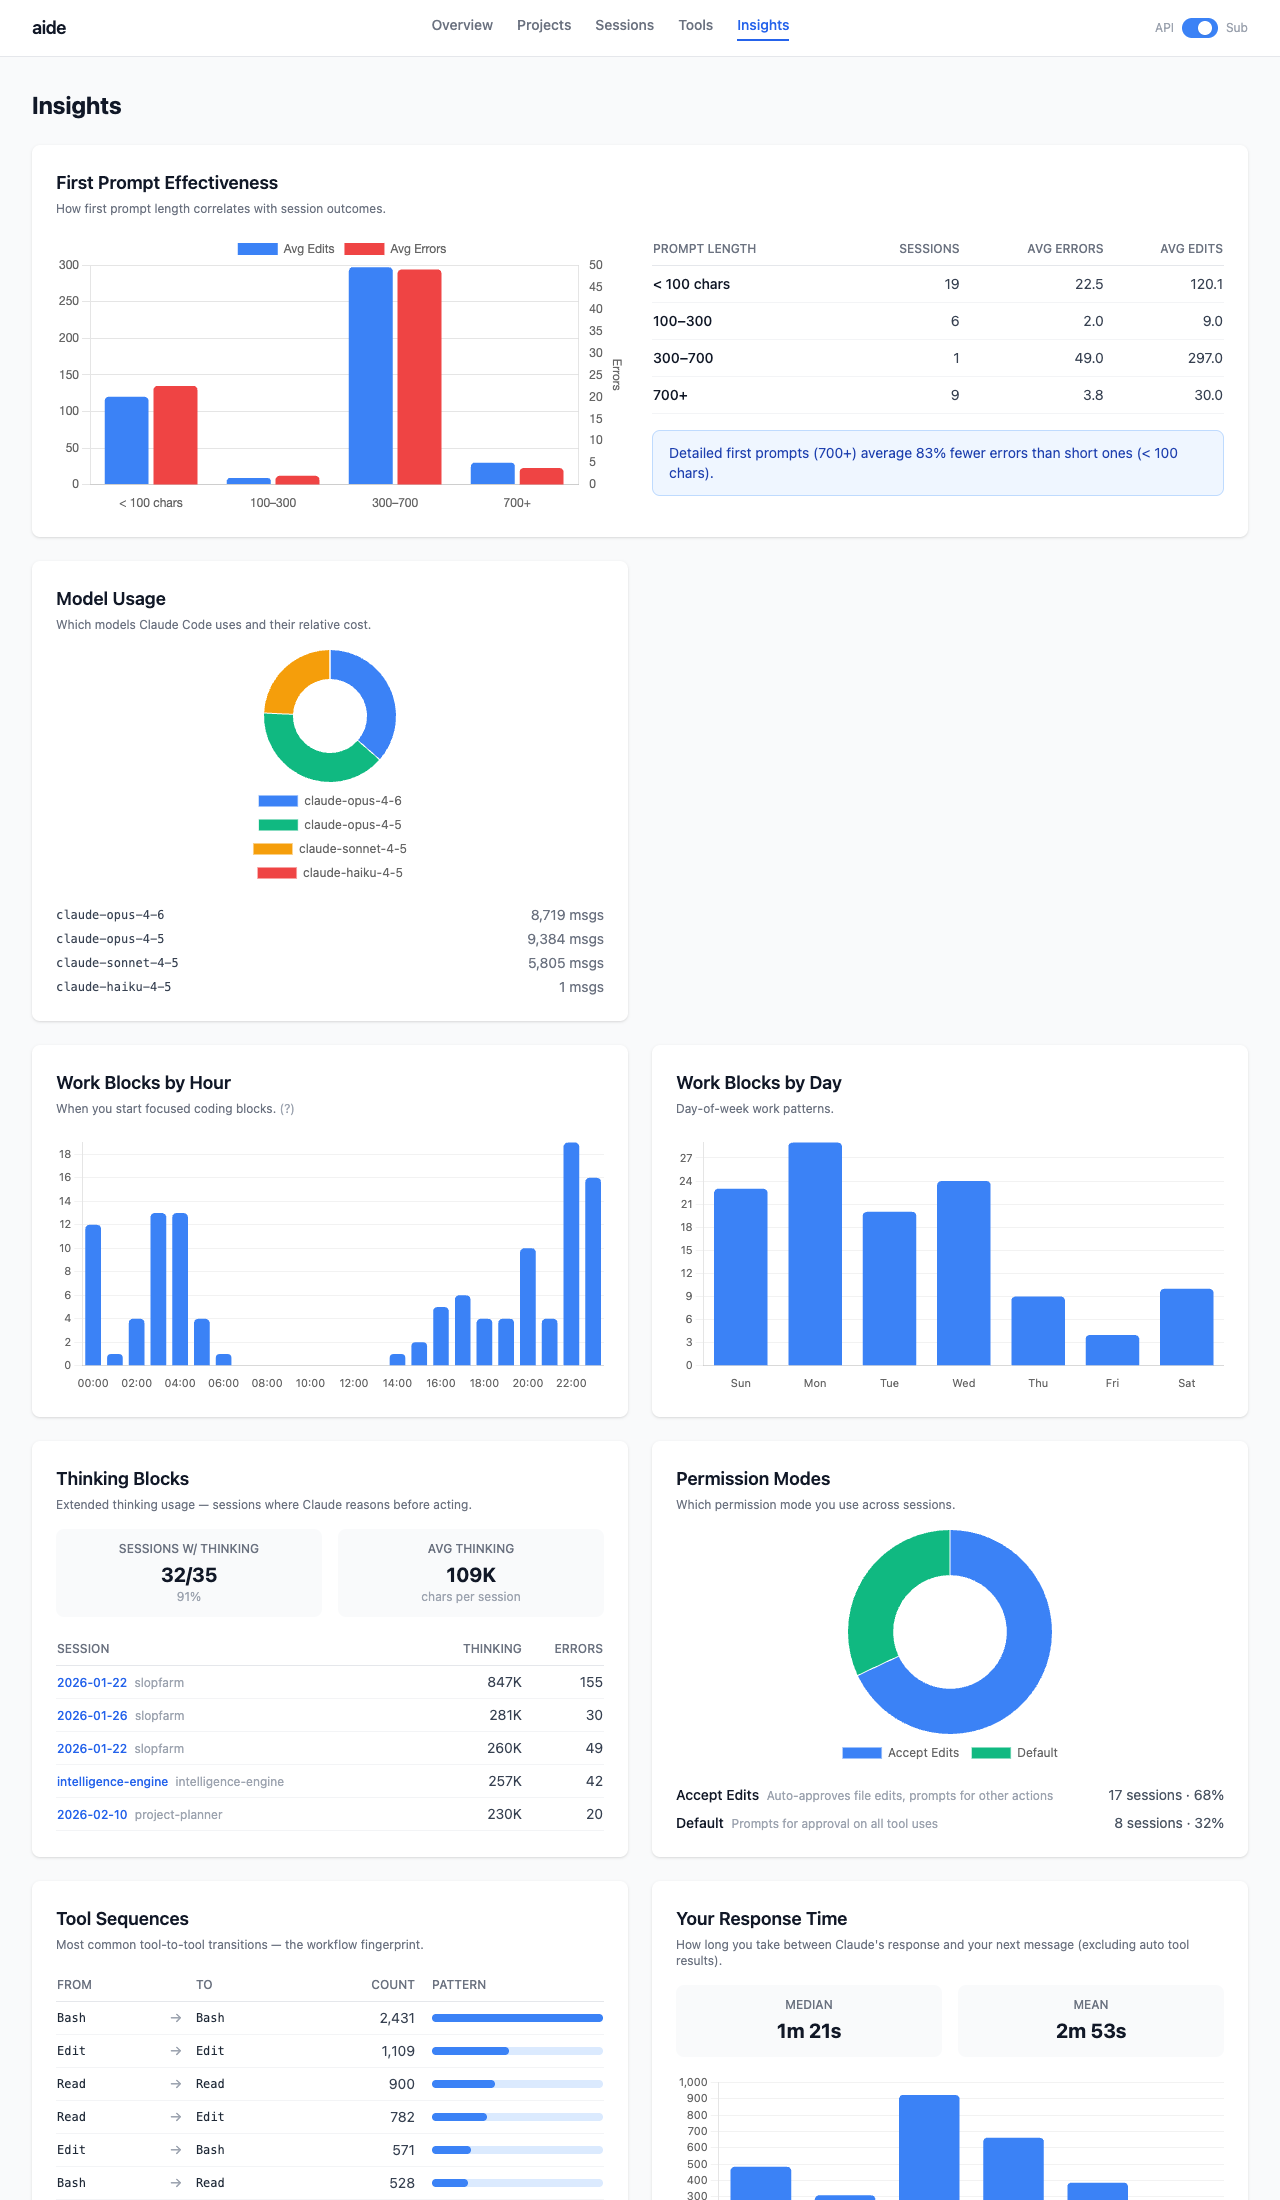
First-prompt effectiveness, cost concentration, time patterns, model usage, tool sequences, thinking block analysis, permission friction, and investigation actions.
More
- Session Autopsy -
aide autopsy <session-id>generates a per-session diagnostic report: cost breakdown, context window analysis, compaction detection, and project-instruction improvement suggestions. - Artifact Review - repeated findings become proposed semantic artifacts. Accepted artifacts feed runbooks and task briefs.
- Subscription Mode - toggle between API cost view and token-based metrics for Pro/Max subscribers.
- CLI Stats -
aide statsprints a quick summary to the terminal without opening the browser.
Technical Details
Work Blocks
A JSONL “session” is just one terminal window staying open. A session spanning Mon-Wed with sleep in between reads as a 48-hour session, making “duration” useless.
The gap distribution between messages is bimodal: most gaps are under 5 minutes (active work), a small cluster is over 30 minutes (away). A 30-minute threshold cleanly separates the two modes.
Each session splits into work blocks, continuous coding periods. “119 work blocks across 35 sessions” tells you more than “35 sessions.”
Error Categorization
Tool errors are categorized automatically: Test (pytest, jest), Lint (ruff, eslint), Build (pip, npm), Git, Edit Mismatch, File Access. Most “errors” are normal iteration (test failures during edit-test-fix cycles). The dashboard separates iteration from actual mistakes.
Effectiveness Metrics
- Cache Hit Rate - % of input context served from cache (higher = better reuse)
- Edit Ratio - % of tool calls that are file edits (higher = more productive)
- Compaction Rate - % of sessions hitting context limits
- Read-to-Edit Ratio - reads per edit (lower = less searching)
- Iteration Rate - sessions with files edited 3+ times
- Review Rate - % of recent sessions that deserve manual review
- Edit Attribution - % of edit/write calls that attach to a file path
AI coding logs are a gold mine. Every tool call, token count, timestamp, and command shape is there. The hard part was deciding which metrics actually matter.
Work blocks changed everything. Raw session duration was misleading for every chart. Splitting at idle gaps made the data honest. Data cleaning matters more than fancy visualizations.
Zero LLM calls was the right constraint. Every metric is heuristic. No API calls, no marginal cost. Re-ingest and rebuild as many times as you want.
Tech Stack
- Python 3.12+ with Click CLI
- Flask + Jinja2 templates
- Chart.js (CDN) for interactive charts
- Tailwind CSS (CDN) for styling
- SQLite (stdlib) for storage
- uv for package management